I tear my hair out every time I see a Democratic primary poll where candidates who could potentially be competitive in Senate races in really difficult states—like Steve Bullock could be in Montana—continue to rack up 0% to 3% support. (O’Rourke, you blew it, we don’t speak your name in this household anymore.) Why? Because control of the Senate matters. A lot.
A Democratic candidate might win the presidency in 2020, but they’ll fail to uphold just about any campaign promise worth mentioning if Mitch McConnell continues to be the majority leader. Democrats control 47 Senate seats (technically, there are only 45 Democratic senators, but independents Angus King of Maine and Bernie Sanders of Vermont caucus with the Democrats). If Donald Trump retains the presidency in November of 2020, Democrats will need to pick up 4 Senate seats. If the Democratic nominee wins the White House, Democrats will need to pick up 3 seats (the Vice President is the President of the Senate and can break ties).
How do we tell what Senate seats are worth fighting for? And what House seats? This is kind of a critical question, especially if you’re someone who makes a habit of donating to or volunteering with political campaigns.
But we’re still months away from primary elections being held, and many potential Senate candidates haven’t decided whether or not to run. Frankly, we’re still at the point where state and national parties need to figure out what seats are worth recruiting high-quality candidates for. How do you tell where to devote resources this far out?
Back in 2016, even before the election that year, Republicans recognized that they had a problem in Orange County, California. They had to know what would play out as the trends they were seeing continued to worsen. And they’d realize the consequences of those changing trends only two years later.
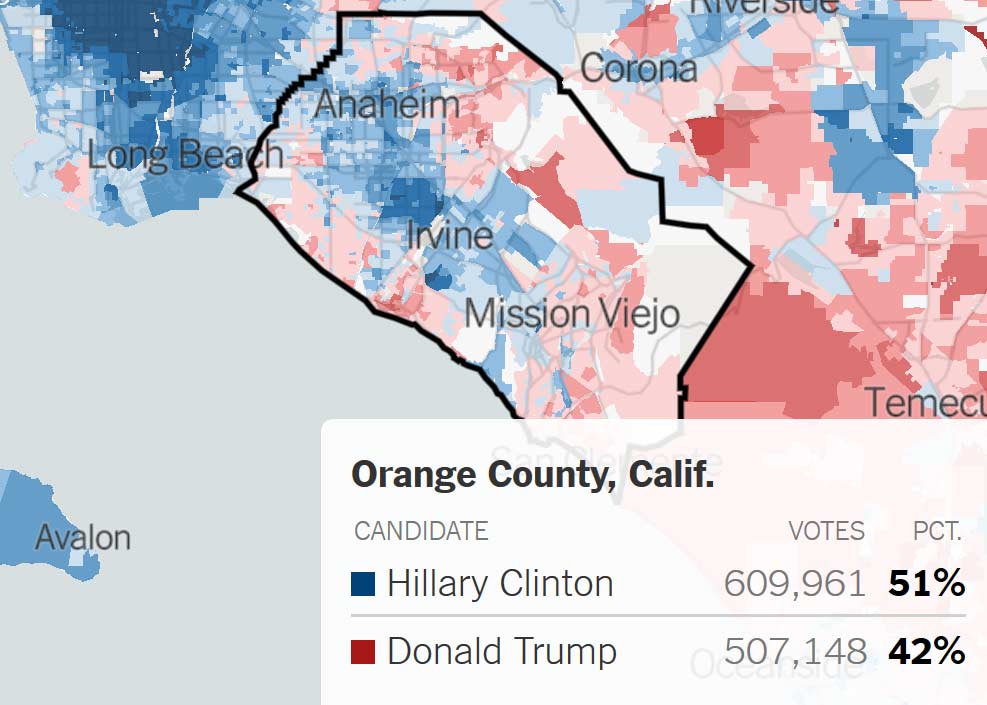
Orange County Republicans were decidedly unenthused by the voting trends in their home county that became blatantly obvious in 2016. Mitt Romney won 51.9% of the vote in Orange County in 2012. In 2016, Clinton won 27,000 more votes than Romney had. Trump got 5,000 fewer than Obama had.
But we’ll address that later.
In the here and now of the months leading up to the 2020 election, how does the average person begin to understand what the likelihood is of getting their favored local Senate or House candidate elected? With a couple simple metrics called the “partisan voting index” and “generic congressional ballot,” we can begin to get a rough idea as to what Senate, House, and state-level seats are worth our attention, despite the fact that the 2020 elections are, as of this writing, still 16 months out.
What is the partisan voting index (PVI)?
The partisan voting index, or PVI, was a political measurement system first developed back in 1997 by the Cook Political Report, a nonpartisan publication for analyzing elections trends founded in 1984. The purpose of the PVI is to express the political bias of each state and congressional district (each of the 435 congressional districts in the United States elects a member of the U.S. House of Representatives).
PVI is calculated by averaging the margin between the Democratic and Republican candidates in a congressional district or state over the previous two presidential elections, and comparing that figure to the average nationwide popular vote for those same two elections.
For instance, let’s say that in 2040, California’s 6th Congressional District (CD-6) votes for the Democratic nominee for president by a margin of 10%. In 2044, they vote for the Dem again, by a margin of 6%. For those two elections, they favor the Democrat by an average margin of 8%.
Meanwhile, at the national level the Republican wins by a 4% margin in 2040, and the Democrat wins by 2% in 2044. The average margin for those two elections at the national level is 1% towards Republicans.
CD-6 has an average margin of 8% for Democrats in 2040-44, while the United States has an average margin of 1%, favoring Republicans. Consequently, the CD-6 has a Democratic bias of 9%. For the purposes of the Cook PVI, this is represented as “D+9.” Note that PVI is only represented as a whole number. So, if CD-6 had a bias of 9.49% towards Democrats, it’d still have a PVI of D+9. When a district or state has no political bias (i.e. D+0/R+0) it’s designated as “EVEN.”
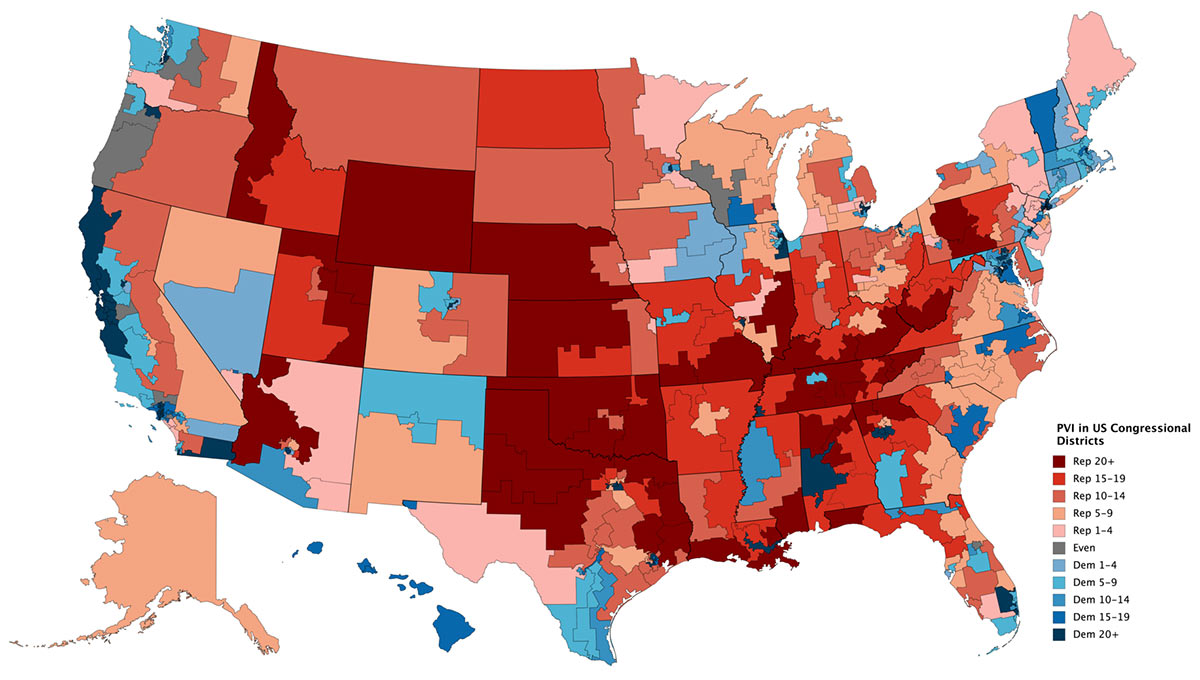
A map of the United States’ 435 congressional districts as they were drawn in 2018, color coded by 2016 PVI. If you’re wondering why some states are a single color, there are seven states that have only one congressional district, and thus one representative.This is because the number of people in each congressional district is supposed to be as close to even as possible, but every state is allotted at least one representative. When CDs were last apportioned in 2010, the average population of a CD was 710,767. There’s some really gnarly math behind the apportionment process.
PVI gives us a handy piece of shorthand for readily identifying whether a candidate is favored in a given seat. But the fact that PVI is used in analyses of House and Senate elections may prompt you to ask, “Why is the PVI calculated based on presidential elections, rather than House or Senate elections?”
The reason is that statistical analysis has shown that the results of House and Senate elections correspond more closely to past presidential elections, than they do, well, House and Senate elections. Or to reverse that comparison, past presidential elections more accurately predict future House and Senate elections.
This can be for a variety of reasons. One of the biggest is that candidate quality can vary wildly from election to election. For example, if Senate elections were used for calculating PVI, Alabama’s PVI would be wildly out of whack in the wake of the 2017 special election where Democratic candidate Doug Jones defeated Republican Roy Moore by 1.7%, after several women alleged that Moore had raped them or made unwanted sexual advances when they were teenagers.
No sane person who pays attention to politics would argue that under normal circumstances, the state of Alabama as a whole is in any way, shape or form favorable to Democrats. Hence why PVI is calculated using presidential elections, where all the chips are down and voters are more likely to vote for the person with a D or R next to their name, and aren’t swayed as much by candidate quality.
But PVI only tells us about the voting biases of a CD or state when compared to the nation as a whole. When the national electorate is shifting one direction or another, it seems obvious that an area that might be neutral or close to it on average would shift in that direction as well. A district that is D+1 on paper might elect a Republican by a 7 or 8 point margin if the national mood strongly favors Republicans.
How can we gauge the national mood when it comes to Senate and House elections (irrespective of how people might feel about the current resident of the White House)? That’s where the generic congressional ballot comes in.
The generic congressional ballot is a poll that’s used to ascertain what party the country favors in Congress, without being biased by how they feel about their local senator or representative.
Understanding what the national mood is critical to understanding how a CD or state will behave. After all, a D+6 district might be an easy double-digit win for Democrats when the national mood favors Democrats, as it did in 2008. But in a red-wave situation like 2010—where many voters were biased against Obama and the Democratic party in the wake of the passage of the Patient Protection and Affordable Care Act (“Obamacare”) in early 2010—that same D+6 district could easily be won by a Republican. And many were.
Conversely, a very Republican-friendly district could be won by a Democrat if everything went their way. This was the case with Utah’s 4th Congressional District in 2018. Despite UT-4 having a PVI of R+13, Democratic House candidate Ben McAdams won the election by 0.26% (696 votes).
This is why, since the 1930s, pollsters have often included a question in their polls (which usually cover a wide range of issues and elections) called the “generic congressional ballot,” also referred to as the “generic vote” or “generic ballot.” The question and the possible answers are structured so that people aren’t prompted about how they feel about their current representative or senator, but instead to get their general party preference. As it turns out, this polling question has a pretty good track record of predicting how House elections play out.
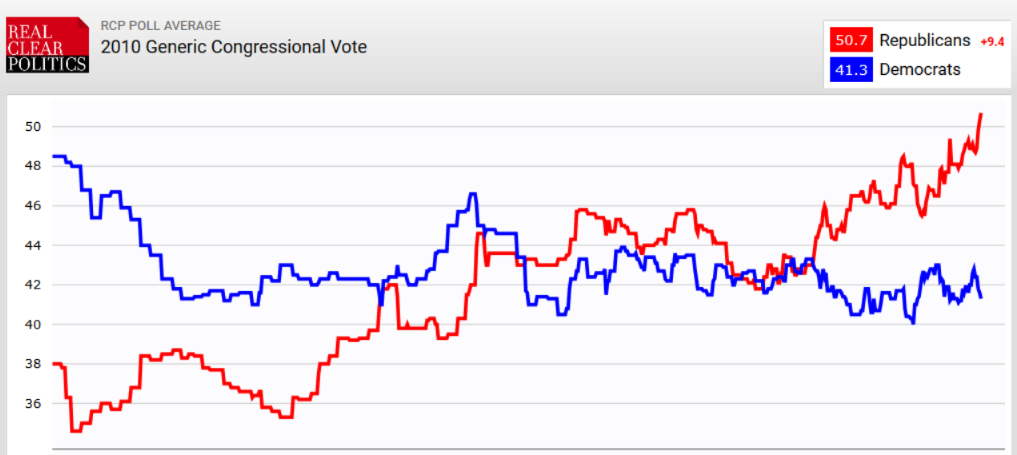
An aggregation of generic congressional vote polls leading up to the 2010 election, when Democrats were put through the wood chipper. The final average margin was R+9.4. In the election, the nationwide vote favored Republicans by 6.8 points.
For instance, in a recent poll, the question was presented as, “If an election for U.S. Congress were being held today, who would you vote for in the district where you live?” The choices offered were the “Democratic Party candidate,” “Republican Party candidate,” and “Other.” Responses where respondents aren’t sure or indicate they won’t vote are usually recorded as well.
This poll allows us to track the national mood, and start to ascertain what races will be easily won, which could be upsets, and which are lost causes.
By looking at the PVI and generic ballot, political parties and their supporters can better understand which races are worth expending limited resources on. Ignoring these trends can lead to catastrophe.
Money. Volunteers. Endorsements from and campaigning by popular politicians. Polling. These are all finite resources, and they have to be budgeted for carefully. Donors could dump loads of money into a highly visible election that’s hopeless, and overlook other less flashy races that could have been won.
In 2018, the eyes of many were on Virginia’s 10th Congressional District.
The incumbent was Barbara Comstock, a popular Republican who many conservative donors were keen to preserve in the face of what looked to be a blue wave year. There may have been an added draw in that she was something of an endangered species: a Republican woman. But there was another aspect of the race that made GOP operatives all the more frantic in their attempts to get sandbags in place ahead of what looked to be a flood of Democratic support in reaction to Donald Trump’s election in 2016.
Historically, VA-10 was a Republican stronghold. As recently as 2012, previous incumbent Frank Wolf had won the seat by 20 points. In a July 2017 post on their website, the National Republican Congressional Committee (NRCC) wasn’t shy in pointing out the district’s history:
Today, the Democrats are finally unveiling their long awaited message. Yes, I know, we are nearly 8 months into the cycle.
They’ve decided the best setting to do this is in Virginia’s 10th District – in Clarke County – where Barbara Comstock got over 63% of the vote in 2016 and 62% in 2014. Democrats have not won the District since the disco era, while blowing over $20 million attacking Barbara Comstock.
Curiously, this seems to have been deceptively worded. It notes that Comstock got nearly two-thirds of the vote in 2016 and 2014. But she didn’t. She won by less than 6 points in 2016, with less than 53% of the vote. Granted, she did win in 2014 by more than 16%, though she only got 56% of the vote that time. It appears that the Republican Party was keen to project strength by alluding specifically to Comstock’s performance in Clarke County (note how the reference to Clarke County is subtly inserted into the first sentence), not the district as a whole. VA-10 covers parts of 3 counties: Clarke, Frederick, and Loudon.
The fact that the NRCC felt the need to be a little deft in their wording betrayed the nervousness they were feeling about the district. Yes, it had been held by Republicans for decades. But Virginia has been slowly drifting leftward for the last few years. This is the especially the case with Northern Virginia, which lies within the deep-blue Capital Beltway encompassing Washington D.C. The Virginia Republican Party has only worsened the problem by pushing hard to the right as the state has drifted left. The result is that the Virginia GOP has been devouring itself with ouroborian intensity.
Yes, VA-10 had once been a cherished red gem for Republicans. But in 2016, Hillary Clinton had won the district by 10 points. Its PVI after the 2016 election? D+1.
Any political operative worth their salt could do the math. Throughout 2018, Democrats had a significant advantage on the generic ballot, never worse than a 3 point edge, but more often around 7 to 8 points. Trying to shore up a D+1 district against a blue wave with sandbags of cash was almost certainly a lost cause.
Nonetheless, the NRCC alone spent $5,012,062 on ads to bolster Comstock’s numbers. This was more than they spent on any other single House race, save for Georgia’s 6th CD. This was a decision that came back to haunt them.
The GOP’s single-minded focus on vanity districts like VA-10 meant that it neglected vulnerable Republican seats that might have been salvaged, such as those in Orange County, California.
Since December 2017, blue-state Republicans in California, New York, New Jersey, and elsewhere had been sounding the alarm in the wake of President Trump signing the Tax Cuts and Jobs Act.
The passage of the law had reduced mortgage interest deductions, and previously unlimited federal tax deductions for state and local taxes (SALT) were capped at $10,000. This proved to be extremely painful for previously faithful patrons of the GOP in states like California with state income taxes and costly real estate. Anyone who remembers the 1988 promise that George H. W. Bush reneged on understands that unexpected tax hikes tend to prompt voter rebellions.
California Republicans were nervous, particularly those in Orange County, California. While much of the country views California as being the heart of Democrat country, Republican presidential candidates won the state in 9 out of 10 elections between 1952 and 1988. While the state had taken a hard turn leftward in the decades since, some regions of California had not… No region of California had more ardently—and stubbornly, and notoriously—so than Orange County.
Orange County’s Republican sensibilities had become so mythologized that it was often described as being “behind the orange curtain.” No Democratic presidential candidate had won the county since Franklin Roosevelt did so back in 1936. But then Hillary Clinton won the county in 2016. And not by a narrow margin. She won by more than 100,000 votes, a margin of 8.59%.
In 2018, there were 4 congressional districts partially or entirely within Orange County with Republican incumbents:
CA-39
- Incumbent: Ed Royce
- Time controlled by the GOP: 6 years
- PVI: EVEN
CA-45
- Incumbent: Mimi Walters
- Time controlled by the GOP: 36 years, since its creation in 1983
- PVI: R+3
CA-48
- Incumbent: Dana Rohrabacher
- Time controlled by the GOP: 26 years, since its creation in 1993
- PVI: R+4
CA-49
- Incumbent: Darrell Issa (Retired in 2018)
- Time controlled by the GOP: 16 years
- PVI: R+1
Maybe these districts could have been saved by the Republican Party. Maybe they couldn’t have. But what we do know is that the NRCC spent just over $5 million on the race for Virginia’s 10th District, despite the fact that VA-10 was a farther reach for the GOP than any of the Orange County seats.
While there was plenty of polling that made the threat to the Southern California seats clear, it didn’t take any pricey analysis to understand what was going to happen unless major steps were taken to protect the seats. You only had to look at the PVI of those seats, and the fact that Clinton had won those districts in 2016, in an environment more favorable to Republicans.
And yet, the amount the NRCC spent on all House races in the state of California, combined? $3,240,367. Nearly half of that was spent on a single race, in California’s 10th District. Of the 4 Orange County races, $97,000 was spent on ads in CA-39, with CA-45, CA-48, and CA-49 each receiving $95,000.
On November 6th, 2018, California’s much vaunted ‘Orange Curtain’ gave way. All four seats were flipped by Democrats. Homeowners in CD-39 near the Richard Nixon Presidential Library and Museum in Yorba Linda, California are now represented by Gil Cisneros.
But the damage to California Republicans was not limited to Orange County.
A little over an hour away from Richard Nixon’s birthplace of Yorba Linda, the Ronald Reagan Presidential Library in Simi Valley (CD-25, 2016 PVI: EVEN) had been faithfully represented by Republicans since 1993. CD-25’s incumbent representative Steve Knight, an Army veteran who had served with the Los Angeles Police Department for nearly 20 years, went into election night believing that he’d grind out another tough victory in a district that Donald Trump had lost in 2016.
Three months later, the Ronald Reagan Presidential Library and its flesh-and-blood constituents’ new representative was sworn in: 31-year-old Democrat Katie Hill, the first openly queer woman to represent California in Congress. Katie Hill beat Steve Knight by nearly 9 points. (See note below.*)
The 14 House Republicans that had represented California had their numbers halved to 7 on election night of 2018. In total, their districts had received 4.3% of the $75 million spent by the NRCC on House elections in 2018.
Barbara Comstock’s race in VA-10 accounted for 7% of that spending. On election night, the race for Virginia’s 10 District was called by news outlets less than 45 minutes after polls closed in Virginia.
Virginia state Sen. Jennifer Wexton has defeated two-term Republican Rep. Barbara Comstock to win a hotly contested race to in Virginia’s 10th District, according to @NBCNews. https://t.co/sN6cKq2MhO pic.twitter.com/Df6jHZ9tc5
— CNBC (@CNBC) November 7, 2018
The Democratic candidate, Jennifer Wexton, won by more than 12 points.
*Postscript: Politics never stops. Things play out in unexpected ways, and all you can do is go with the flow. Katie Hill resigned her seat on November 1, 2019, in the wake of an acknowledged relationship with a campaign staffer, allegations of a relationship with a House aide, and the publication of nude photos distributed by former advisors to the very incumbent, Steve Knight, she unseated almost exactly one year prior. There will be a special election in the coming months, featuring most notably Christy Smith, the incumbent assemblywoman from California’s 38th Assembly district, and George Papadopoulos, a former advisor to President Donald Trump.