A couple weeks ago I started writing about an analysis I put together of the 2020 Senate races, based upon an examination of PVI and generic congressional ballot polling. I got a thousand or so words in before I realized that what I really had was a standalone article explaining the consequences of over-investing in sexy but unwinnable races, while ignoring genuinely winnable races. That article also explains what the hell PVI and generic ballot polling are, so if you haven’t already, please read that first.
That being said, here I’ll describe my inspiration for this analysis, how I devised it, and how it works
In 2020, 34 states will hold elections for one of their two seats in the United States Senate.
On November 3, 2020, 99% of the country is going to be wondering if Donald Trump will be reelected as president. At this point, it looks like a coin flip. Unless something drastic happens, like Trump’s attempts at staving off the economic downturn he fears backfiring spectacularly, the presidential election in 2020 will likely still be a roughly 50/50 coin flip.
However, on that same day, 34 Senate seats will be up for grabs. Control of the Senate has a huge impact on the ability (or inability) of whoever is elected president to pass legislation which advances their agenda, and thus warrants everyone’s attention.
I’m focusing on the Senate for a reason. Democrats are heavy favorites to hold the House. If the party’s fortunes worsen enough that the House is in doubt, they have no chance of flipping the Senate or winning the White House. Thus, Democratic supporters should be paying keen attention to the fight for the Senate.
The Republican Party holds 53 Senate seats, and Kentucky Senator Mitch McConnell currently serves as Senate majority leader. For the Democratic Party to reclaim control of the Senate in 2020, it must either:
Win 3 seats if Donald Trump loses, as the vice president is Senate president and breaks all ties, allowing the party which controls the White House to also control the Senate with only 50 seats.
Win 4 seats if Donald Trump wins, to secure a majority of 51 seats. This is probably an unlikely scenario. If Democratic performance is anemic enough to allow Trump to win in 2020, we’ll also likely see a repeat of 2016 in the Senate as well. That year, Republicans had a net loss of 2 seats, which wasn’t enough to swing control to the Democrats. With a Trump win, we’d likely see a Republican gain or loss in the Senate of up to 2 seats—insufficient to change the status quo.
But Democrats don’t need to win an immense number of Senate seats to take control of the Senate in 2020. They need to win 3 to 4. Recognizing that a very small handful of Senate seats could have a massive impact on the direction of the country post-2020, I started wondering if, despite the fact that we’re still more than a year out from the election…
Is there a way to identify which Senate races are potentially winnable for Democrats, which are lost causes, and what races we might be overlooking?
As I stated in the prelude to this write-up:
Money. Volunteers. Endorsements from and campaigning by popular politicians. Polling. These are all finite resources, and they have to be budgeted for carefully. Donors could dump loads of money into a highly visible election that’s hopeless, and overlook other less flashy races that could have been won.
How do you identify Senate races that are worth diverting valuable donor dollars towards? Which races should you phone bank for? Which races should you go door-to-door for?
Well, first you have to know which elections are winnable.
It’s rather early to be prognosticating on Senate seats, given that most non-incumbent candidates haven’t actually declared yet for an election that is, as of this writing, still 15 months off. This poses a challenge when it comes to forecasting. There are a few random Senate race polls out there. But polls of, say, Maine Senator Susan Collins versus “Generic Democrat” aren’t super predictive in the long run. Polls only really become usefully accurate once the candidates are known.
This posed a problem. Understanding whether or not a seat is feasibly flippable requires an understanding of (1) the national dynamic, and (2) the characteristics of the electorate of a given Senate seat. After chewing on the problem a bit, I decided to take a crack at the problem by building a spreadsheet that took the PVI of each state and added it to the current generic congressional ballot to produce a projected margin (the current average generic congressional ballot is used to try and anticipate the congressional popular vote—how many people voted D versus R).
Even a cursory glance at the results of this effort made it clear this was a half-baked approach. With the current average generic ballot being Democrats winning by 8, the result was that Mississippi with its PVI of R+9 would be a narrow 1-point victory for Republicans in 2020.
While it’s a nice thought… LOL.
To accurately project Senate elections, you have to account for the differences in how voters vote for various offices.
In 2006, the state of California reelected Diane Feinstein for her approximately 876th term as senator by a margin of 24.4%. Not all that surprising, especially given how far to the left California has drifted, especially in recent years.
But on the exact same day, November 7, 2006, California reelected Arnold Schwarzenegger, a Republican, as governor of California by a margin of 17%.
Same state. Same voters. Same day. And a difference in voting margins of more than 40 points. WTAF, y’all.
Fast forward 2 years, to the day on which Barack Obama won the presidency by a margin of more than 7 points, and Democrats went from controlling 51 seats in the Senate to controlling 59.
Let’s hone in on the Senate race in Alabama. On that day in 2008, Democrats won congressional ballots nationwide by a margin of 10.7%. Alabama at that time had a PVI of R+8. Ergo, obviously, simple math tells us that incumbent Jeff Sessions lost his reelection bid by a margin of 2.7% to Vivian Davis Figures, who had represented Alabama’s 33rd district for more than a decade in the Alabama State Senate.
No, wait. That’s not right at all. Jeff Sessions won reelection by a margin of just under 27%.
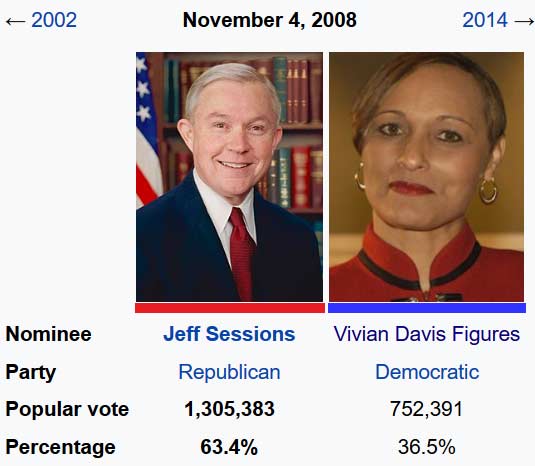
Despite the fact that Republicans across the country were swept away by a George W. Bush-inspired tsunami, Jeff Sessions significantly overperformed expectations, even for a pretty red state like Alabama.
Why did Feinstein do so well in California, despite Schwarzenegger’s reelection? Why did Sessions win so easily in an environment so biased against Republicans? Well, political incumbents enjoy a pretty significant electoral advantage, unless they’re terrible politicians (or people) or happen to be in lockstep with a party that’s loathed at the moment. (Schwarzenegger was a Republican, but was very politically moderate and held in check by a Democrat-controlled majority. A similar dynamic can currently be seen in Massachusetts, Maryland, New Hampshire and Vermont.)
Split-ticket voting (where an individual votes for candidates of both parties in the same election) has become rarer in recent years. But it still happens a lot. And a fair number of people switch party allegiances, depending on the circumstances. While many people vote the same straight ticket year to year, many still base their vote on the office for which a candidate is running, and the larger political environment in which a candidate will be exerting influence. They may want Republican representation at the state level where Democratic influence is strong, but Democratic representation in the U.S. Congress (or the White House) where Republicans are strong. Or, vice versa.
Voters are complicated and contrary. How do you account for all of these variables when trying to project Senate elections?
Behold, the Senate election deviation (SED). An attempt at accounting for how voters in a given state behave when voting for senators.
In reflecting on the problem, I recognized that I was trying to account for (at minimum) three variables when trying to compute a likely outcome for each election:
Congressional Popular Vote + State PVI + State’s Bias Voting for Senator = Final Margin
Those first two variables can be accounted for simply by looking at the historical record. And by doing that, by process of elimination, we can extrapolate (roughly) the inherent bias a state has when voting for Senate candidates.
What I did was I took Senate races in the 34 states in question going back to 2008, for each race I took the final margin and subtracted out the PVI and congressional popular vote in order to produce a measure of deviation from the margin that would be expected when accounting for only those two variables.
For instance, in 2018 in the state of Michigan, incumbent Democrat Debbie Stabenow faced off against challenger John James. The state of Michigan’s PVI that year was D+1, and 2018’s congressional popular vote was D+8.4. Thus, the expected margin would have been Stabenow winning by 9.4 points. But she actually only won by 6.5 points. That under-performance equaled 2.9 points. Thus, the Senate electoral deviation (SED) for that race was R+2.9.
With multiple races in a state, I could compute an average deviation for each state. This deviation could then be applied to the current generic congressional ballot and each state’s PVI to produce a projected vote margin. The result was this spreadsheet.
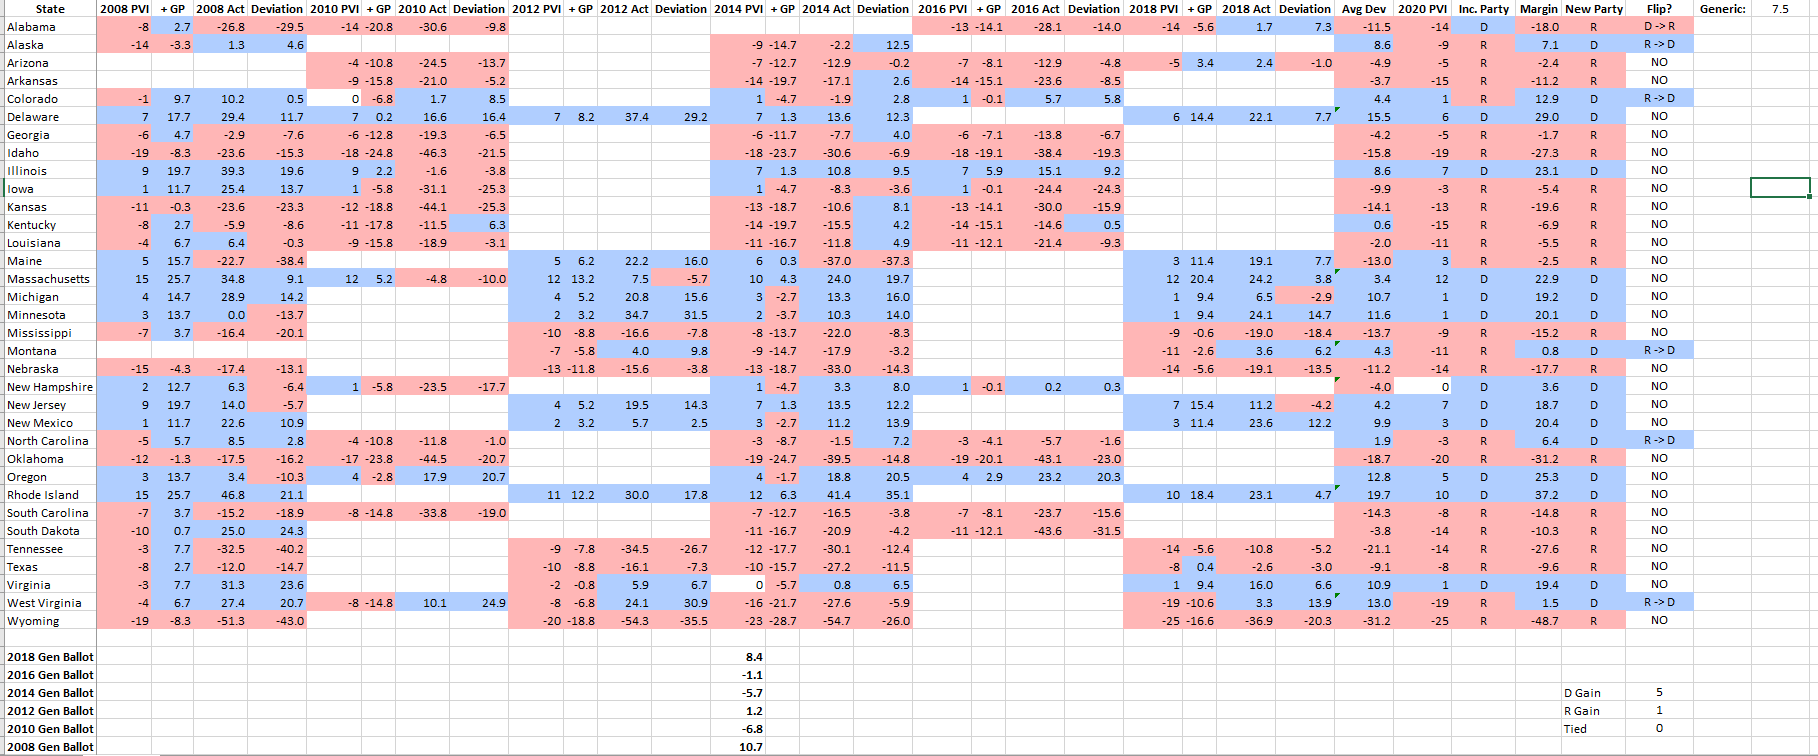
Once a SED value is calculated for all the races examined, this value is averaged, and used to calculate a projected 2020 Senate race vote margin for each state:
Current Average Generic Ballot + 2020 State PVI + Average SED = Projected Margin
As should be evident, this is not a neat and tidy approach. And there were many instances in which I had to make a subjective decision as to whether to include a race or not when calculating an average SED value.
For instance, Alaska has consistently been a pain in the ass. In 2010, incumbent Lisa Murkowski was unseated in the primary (“primaried) by Joe Miller, a Tea Party Republican. Instead of giving up, Murkowski ran as a write-in candidate. Thus, there were 3 major candidates in that race: Republican Joe Miller, Republican Lisa Murkowski, and Democrat Scott McAdams.
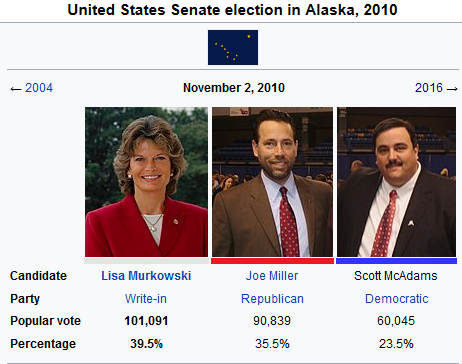
How do you interpret that? From one perspective, you could say that the margin of victory for Republicans versus Democrats was 51.5%, if you total the two Republicans’ performances, and subtract McAdam’s vote count. Or do you average Murkowski’s and Miller’s numbers, and then subtract McAdam’s figure from that average (37%) from that average? The problem with either approach is that it ignores the fact that many Democrats and left-leaning independents likely opted to vote for the more moderate Murkowski, rather than a Democrat they viewed as having little shot.
Ultimately, I chose to completely discard that race, as well as the subsequent 2016 Alaska Senate race, where Murkowski defeated three major candidates: Joe Miller running as a Libertarian, an independent candidate, and a Democratic candidate. A couple other similarly messy races elsewhere were discarded.
I also discarded the 2008 West Virginia Senate election. This is because Jay Rockefeller, a very popular old-school Democratic incumbent, won by more than 27 points. This is a situation where incumbency advantage had a huge effect on the race. And there’s also the fact that West Virginia has reddened at warp speed (it had a PVI of R+4 in 2008, versus R+19 in 2018). Decade-old election has little relevance to understanding the state’s future behavior. But even after discarding that race, I’m not at all comfortable with the SED I calculated for West Virginia. But I’ll get to that in a bit.
One other major quibble. In Maine, Angus King runs as an independent, but caucuses with Democrats. I’ve opted to designate him as a Democratic candidate for the purposes of my analysis (which is critical to projecting the fortunes of Maine’s other incumbent, Susan Collins). This is somewhat sketchy, but my data set is limited, as are my options.
Now that all the preamble is out of the way, you can get to the good stuff: my analysis of the 2020 US Senate election.